 指標的解讀與應用")
Contents
Introduction
When CPU, memory, or I/O devices experience contention, workloads suffer from latency spikes and throughput loss, and face the risk of OOM termination. Without accurate measurement of such contention, users are forced to either manage their hardware resources conservatively or risk frequent disruptions caused by over-provisioning. Since Linux kernel 4.20, the Linux kernel has included PSI (Pressure Stall Information), allowing users to more accurately understand the impact of resource shortages on overall system performance. This article will briefly introduce PSI and how to interpret its data.
Overview
PSI provides the first canonical way to monitor resource pressure increases, offering new pressure metrics for three primary resources: memory, CPU, and I/O.
These pressure metrics, combined with cgroup2 and other kernel-space and user-space tools, enable you to detect resource shortages as they develop and take action by pausing or terminating non-essential processes, redistributing memory within the system, reducing load, or taking other measures.
PSI statistics act like an early warning system, providing alerts for impending resource shortages and allowing you to take more proactive, granular, and nuanced steps as resources begin to become scarce.
Pressure Metrics Interface
Pressure metrics for each resource can be read through their /proc/pressure corresponding files in,cpu、memory和io。
You can easily read the pressure metrics for the corresponding resources using the following commands:
$ cat /proc/pressure/resource_nameThe output format is as follows:
some avg10=0.42 avg60=0.18 avg300=0.14 total=2539018569
full avg10=0.00 avg60=0.00 avg300=0.00 total=0
It contains two metrics,some 和 full, along with their 10-second, one-minute, and five-minute averages.total is the total time calculated in microseconds.
Interpreting Pressure Metrics
After knowing how to read the pressure information, the next step is to understand how to interpret it.
some
some shows the percentage of time that some (one or more) tasks were delayed due to resource shortages, such as insufficient memory.
In the chart below, task A runs without delay, while task B must wait 30 seconds for memory, resulting in a "some" value of 50%.
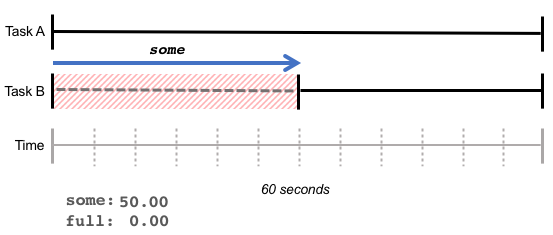
some represents the increased latency due to resource shortages: although the total amount of work completed by the CPU may remain unchanged, certain tasks took longer.
full
full Represents the percentage of time all tasks are delayed due to resource shortages, indicating the amount of time with absolutely no output.
In the example below, task B waits for memory for 30 seconds; during these 30 seconds, task A is also waiting for 10 seconds. This results in full a value of 16.66% (10s / 60s),some a value of 50.00% (30s / 60s).
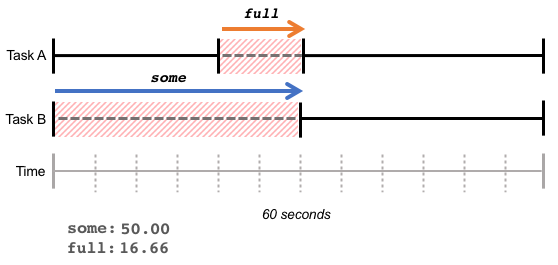
高 full The value represents the loss in overall throughput, where the total amount of work completed decreases due to resource shortages.
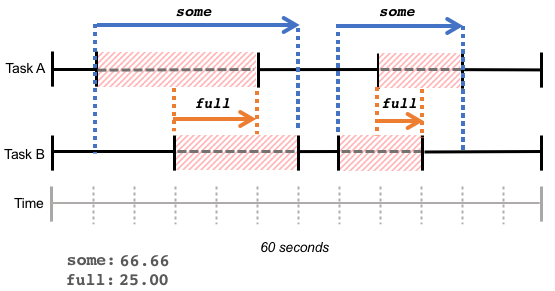
Please note that these statistics reflect the cumulative waiting time of tasks over a period, whether that waiting time is continuous (as in the example above) or a series of fragmented waiting times within the same period, as shown in the figure below:
Monitoring PSI
We can monitor the system's PSI through node_exporter. The pressure collector is enabled by default in node_exporter, allowing you to obtain the following information:
- Node CPU Pressure Waiting Seconds (Total)
- Node IO Pressure Stalled Seconds (Total)
- Node IO Pressure Waiting Seconds (Total)
- Node Memory Pressure Stalled Seconds (Total)
- Node Memory Pressure Waiting Seconds (Total)
Summary
Pressure metrics are inexpensive to read and can be used to sample recent delays or to sample before and after specific task operations to determine their resource-related latency. Users can leverage these metrics to better understand if excessive resource contention exists within the system and take appropriate action.
Reference
Copyright Notice: All articles on this blog are licensed under CC BY-NC-SA 4.0 unless otherwise specified.

