 指標的解讀與應用")
Table of Contents
前言
當 CPU、記憶體或 I/O 裝置發生競爭時,工作負載會經歷延遲峰值、吞吐量損失,並且面臨 OOM 終止的風險。在沒有準確測量此類競爭的情況下,使用者被迫要麼保守地運用他們的硬體資源,要麼冒險經常遭受因過度設定而引起的中斷。在 Linux kernel 4.20 之後,Linux kernel 加入了 PSI (Pressure Stall Information) 這個資訊,讓使用者可以跟精確的了解到資源不足對整個系統的效能影響。本篇文章將會簡單介紹 PSI 跟如何解讀其資訊。
概述
PSI 提供了首次看到資源壓力增加的正統方式,它為三個主要資源——記憶體、CPU 和 IO 提供了新的壓力指標。
這些壓力指標,結合 cgroup2 和其他 kernel space 和 user space 工具,使您能夠在資源短缺發展時偵測到,並通過暫停或終止非必要的 process,系統內重新分配記憶體,減輕負載,或採取其他行動。
PSI 統計資料就像是預警裝置,提供即將發生的資源短缺的警告,使您在資源開始變得稀缺時,能夠採取更積極、細緻和微妙的步驟。
Pressure metric interface
各個資源的壓力指標可以透過其在 /proc/pressure 中相對應的檔案讀取,cpu、memory和io。
可以簡單透過以下指令讀取相對應資源的壓力指標:
$ cat /proc/pressure/resource_name輸出的格式如下:
some avg10=0.42 avg60=0.18 avg300=0.14 total=2539018569
full avg10=0.00 avg60=0.00 avg300=0.00 total=0其中包含了兩項指標,some 和 full,與其 10 秒、一分鐘、五分鐘的平均值。total 則是以 microseconds 計算的總時間。
Pressure Metrics 解讀
知道怎麼讀取壓力資訊後,接下來需要知道怎麼解讀這些資訊。
some
some 顯示由於資源不足,例如記憶體不足導致某些(一個或多個)task 延遲的百分比。
在下面的圖表中,task A 無延遲執行,而 task B 則需等待 30 秒以獲得記憶體,導致某些值為 50%。
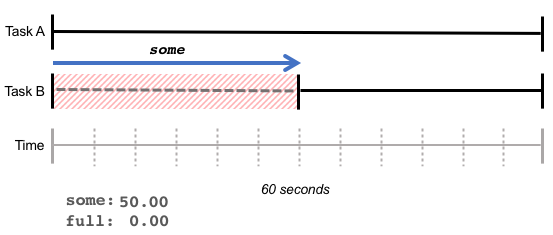
some 表示由於資源不足而增加的延遲時間:雖然CPU完成的工作總量可能保持不變,但某些 task 花費了更長的時間。
full
full 表示所有 task 由於資源不足而延遲的時間百分比,即完全無產出的時間量。
在下面的例子中,task B 等待記憶體 30 秒;在這 30 秒中,有 10 秒 task A 也在等待。這導致 full 值為 16.66%(10 秒/60 秒),some 值為 50.00%(30 秒/60 秒)。
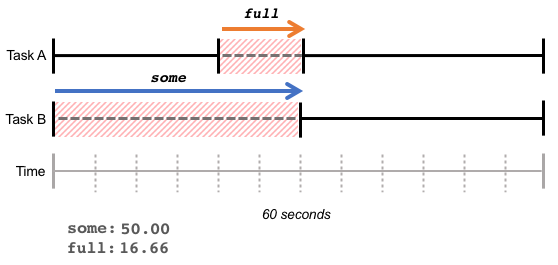
高 full 值表示整體吞吐量的損失,由於資源不足,完成的工作總量減少。
請注意,這些統計資料反映了任務在一段時間內累積等待的時間,無論等待時間是連續的(如上面的例子),還是在相同的一段時間內的一系列分散的等待時間,如下圖:
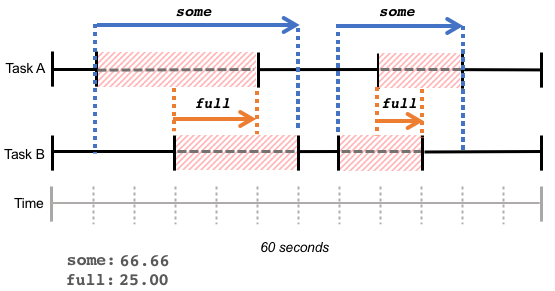
監控 PSI
我們可以透過 node_exporter 來監控系統的 PSI。node_exporter 預設開啟了 pressure collector,可以通過它獲得以下資訊:
- node_pressure_cpu_waiting_seconds_total
- node_pressure_io_stalled_seconds_total
- node_pressure_io_waiting_seconds_total
- node_pressure_memory_stalled_seconds_total
- node_pressure_memory_waiting_seconds_total
小結
壓力指標讀取成本低,可以用來抽樣近期的延遲,或在某些任務操作之前和之後抽樣,以確定它們與資源相關的延遲時間。使用者可以利用這個指標來更了解系統中是否存在過度資源競爭的行為,並且對其進行處置。
Reference
Copyright Notice: All articles in this blog are licensed under CC BY-NC-SA 4.0 unless stating additionally.
